Table of Contents
Definition and Basics
An infographic (also written information graphic) is a visual representation of information or knowledge as images, diagrams, graphs and sparse written text. It is also superior in education, marketing and reports as compared to plain text which does not have the ability of processing the information 60,000 times faster through the eyes.
The key characteristics include hierarchy (bold headings, icons), focus on the color coding, and scannable layouts to guide the viewers. Its first applications date back to cave painting and it was modernized to the digital forms after 2000s through applications like Adobe illustrator.
What Makes a Good Infographic?
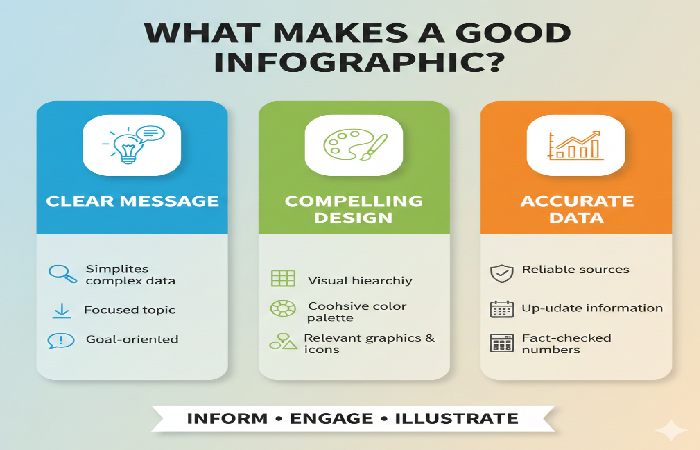
An effective infographic is appealing on the eyes at first sight with the help of clear visual hierarchy: bold headings, size difference, and a clever use of color coding makes the eye move through the most important statistics, and supporting information, easily, requiring being scannable on the mobile device. It is not overly complex, yet impactful with a small palette (one main color, accents, neutrals), repetitive icons or drawings, and lots of white space that is used to make complex information digestible in a matter of seconds. Credible data (referenced visually) is more convincing, but so is the brand-relevant typing and viewer-centered storytelling, which presents a logical message-minimalist to skim and share or maximalist to immerse and read, which in turn increases the retention by 80 percent and shares three times as much as text.
Why Use Infographics?
Infographics are more engaging as well as well-designed infographics drawing up to 12% traffic to a site. They improve retention -80% of visual data is remembered by the audience as compared to 20 percent of written-and simplify complex topics to a broader audience.
Their share increases 3 times, compared with text posts in marketing and helps to optimize search with back links and image search. The drawbacks include the design time and the potential misinformation in case there are no sources of data.
Recent statistics (2024-2026): 65% developed better understanding; multifunctional on social media, blogs, and presentation.
5 Types of Infographics
- Statistical: Visualize data trends with charts/graphs, e.g., e-learning growth stats.
- Informational: Explain concepts via icons/text, like process guides.
- Timeline: Show chronological events, e.g., company history.
- Comparison: Contrast items using tables/Venn diagrams, e.g., tool features.
- Geographic/Process: Map data or workflows, e.g., regional trends or steps.
| Type | Best For | Example Use |
| Statistical | Data trends | Social media stats 2026 |
| Timeline | History/evolution | Brand milestones |
| Comparison | Product vs. product | AI tools showdown |
| Informational | How-tos | SEO steps |
| Geographic | Location data | Market maps |
Real-World Examples and Case Studies
A utility company’s infographic reduced accidents by visualizing fleet data, using charts for metrics and icons for insights. Unidata’s crowdsourcing efficiency visual generated 23 leads in 2 months, outperforming text case studies.
Facebook 2025 stats infographic used grids/icons for quick scans, ideal for reports. These cases show 45% lead gen boosts via visuals.
Top Tools for 2026
AI tools dominate: Venngage, Canva, Piktochart excel in auto-generation.
| Tool | Key Features | Pricing | Best For |
| Powerdrill Bloom | Nano Banana engine, data-to-story | Paid | Business visuals |
| Canva | Magic Studio, Brand Kit | Free/Paid | Beginners |
| Infogram | Real-time data, 35+ charts | Free/Paid | Maps/news |
| Piktochart | AI outlines, Sheets sync | Paid | Data pros |
| Visme | Animations, case studies | Paid | SaaS/tech |
Pros: Fast creation; cons: Limited free customization.
How to Create an Infographic
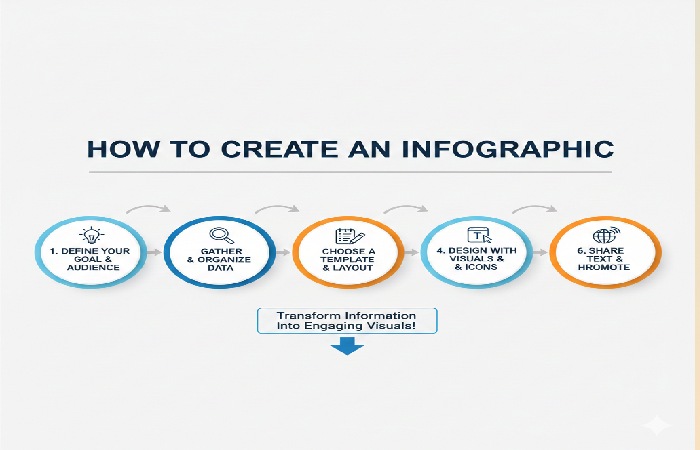
- Research data from credible sources (e.g., studies 2023+).
- Outline: Define goal, audience, key message.
- Design: Use hierarchy, 40/60 visual/text ratio, brand colors.
- Add sources/CTA; optimize for SEO (alt text: “infographic types 2026.png”).
- Tools like Canva: Import data, auto-generate, export PNG/SVG.
Common mistakes: Overloading info, ignoring mobile responsiveness. Test for scannability.
SEO Best Practices
Embed in blogs with keyword-rich context; filename “infographic-examples-2026.png”. Alt text: “Comparison of top infographic tools 2026”. Earn backlinks by sharing on Visual.ly or Pinterest.
Free online infographic makers enable quick creation of visuals like the SEO blog commenting guides we’ve discussed, using templates without software installs. Canva’s free tier stands out for beginners in content marketing.
Top Free Tools Table
| Tool | Key Free Features | Limitations | Best For |
|---|---|---|---|
| Canva | Drag-drop templates, charts, millions of icons, exports PNG/PDF. | Watermarks on premium; 5GB storage. | Beginners, social media posts [conversation context]. |
| Piktochart | 100+ templates, data import, basic animations. | Limited exports (5/month), no custom fonts. | Reports, timelines. |
| Infogram | Interactive charts/maps, real-time data, embed codes. | 50 charts max, branded footer. | Stats-heavy infographics. |
| Venngage | 8K+ templates, AI suggestions, team collab. | 5 designs/week, basic exports. | Marketers, educators. |
| Visme | Icons/animations, data widgets, PDF exports. | 5 projects, no animations in free. | Presentations, flyers. |
FAQ Section
What is an infographic?
A visual data representation using charts and minimal text for quick insights.
What are the benefits of infographics?
Boost engagement (12% traffic), retention (80% visual recall), and shares.
What are the main types of infographics?
Statistical, timeline, comparison, informational, geographic.
What are the best free infographic tools in 2026?
Canva basic, Infogram starter for charts.
How do infographics help SEO?
Drive backlinks, image traffic; use optimized alt text and embeds.
Final Conclusion
Mastering infographics means harnessing their proven power—boosting retention by 80%, site traffic by 12%, and shares 3x over text—for education, marketing, and reports. From statistical trends to comparison charts, use free tools like Canva for quick wins, embed with keyword-optimized alt text (“infographic types 2026”), and promote on Pinterest for backlinks. Avoid pitfalls like overload or uncredited data; focus on credible sources and mobile-friendly designs to outrank competitors. Integrate into your SEO strategy today alongside blog commenting for compounded results—your visuals will educate, engage, and elevate rankings sustainably.